4.2.7 GB/T4797.7 Classification of Environmental Conditions Natural Environmental Conditions Earthquake Vibration and Shock
This section provides information on the environmental conditions under natural earthquake vibration and impact.
Its purpose is to define some basic characteristics and characteristic quantities of earthquakes, in order to provide background materials for products that may be subjected to these conditions during storage and use. Only the acceleration of ground conditions is given, and structural conditions are mentioned, but it is limited to the description of general conditions.
1. Overview
The impact of earthquakes is vibration, which can be simulated through random processes. This vibration will have an impact on the product and generate various forms of stress on the product.
This section aims to provide information on earthquakes and the dynamic performance of products during earthquakes. The values given in this section are typical examples and should not be used as standard values.
1.1) Origin and propagation of seismic vibration
When stress accumulates enough to cause damage to the Earth's crust, an earthquake occurs. These unstable factors exist in seismic active areas, which are related to geographical factors such as troughs, ridges, ridges, volcanoes, trenches, tectonic faults, etc.
The potential energy released by a sudden rupture will propagate outward from the source in three fundamental wave forms:
——Longitudinal waves cause compression or expansion of rocks in the direction of propagation;
——Shear waves, perpendicular to the direction of propagation, cause the rock to undergo torsional shear;
——Surface waves are a combination of the first two waves, subject to ground conditions.
1.2) Characteristics of seismic vibration
Earthquakes generate random ground motion, which has the characteristic of simultaneous but statistically independent horizontal and vertical components. Moderate earthquakes can last for 15 to 30 seconds, while strong earthquakes can last for 60 to 120 seconds. Generally speaking, the intensity with maximum ground acceleration can reach 10 seconds. A typical broadband random vibration has the maximum energy in the frequency range of 1Hz-35Hz, and earthquakes in the frequency range of 1Hz-10Hz are more destructive to the product. Usually, it is assumed that the vertical component of ground motion below 3.5Hz is 67% to 100% of horizontal motion, and above 3.5Hz it is equal to horizontal motion.
Note: The maximum acceleration is usually used to describe the seismic intensity specific to a specific site.
1.3) Products on foundation
The typical broadband spectrum describing ground motion is mainly driven by multi frequency excitation. For products installed on the foundation, the vibration of ground motion (including horizontal and vertical) may be amplified. For any given ground motion, the degree of amplification depends on the characteristic frequency and damping characteristics of the system (soil, foundation, and product) vibration.
1.4) Products within buildings and structures
Ground motion (mainly horizontal motion) can be filtered or amplified as an intermediate building structure to generate varying amplitude sinusoidal vibrations of the floor. The typical narrowband spectrum describing the motion of building floors is mainly single frequency excitation. The acceleration of products installed on building floors may reach several times the ground acceleration, depending on the damping ratio of the system and the characteristic frequency of vibration. The degree of amplification and bandwidth depend on the dynamic characteristics of each building and product structure. Products that are sensitive to vibrations with frequencies ranging from 5Hz to 8Hz are most susceptible to impact.
2. Earthquake level
According to seismology, earthquakes are classified according to their intensity or magnitude.
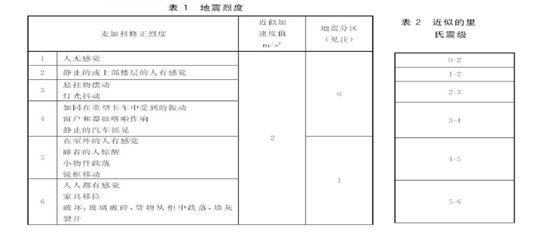
The seismic intensity [such as the modified MSK magnitude or MERCALLI CANCANCANI-SIEBERG (Macquarie magnitude) level] is determined based on experience and classified according to its impact (refer to Table 1).
The magnitude of an earthquake (such as the Richter scale) is determined based on recorded data and used to evaluate the seismic energy released by the source.
These levels can roughly correspond to certain values of ground acceleration, and the experimental data obtained from this is limited.
The approximate relationship between Richter magnitude and ground acceleration is shown in Table 1. The acceleration values given in Table 1 are for ground conditions. Considering the following factors, only an approximate relationship can be given between the acceleration value of the product and the Richter scale:
——Soil and rock conditions (including saturated water);
——The distance from the epicenter;
——The situation of the structure or product foundation.
The approximate relationship between earthquake intensity and earthquake magnitude is shown in Table 2, which lists the Richter scale magnitudes and aligns them with Table 1. It should be noted that this relationship can be influenced by the following factors:
——The soil and rock conditions of the site;
——Source depth;
——Duration of earthquake action.

3. Description of seismic environment using response spectrum
3.1) Response spectrum
The response spectrum method is a widely accepted design description method specifically used for testing seismic environments. In the response spectrum, the maximum response of a certain family of oscillators (each oscillator has its corresponding single degree of freedom and fixed viscous damping) is expressed as a function of the characteristic frequency of the vibration, which is caused by ground motion acceleration caused by earthquakes (it can be seen that the response spectrum is not the true spectrum of ground vibration).
An example of an acceleration record (natural time history) of a real earthquake is shown in Figure 1.
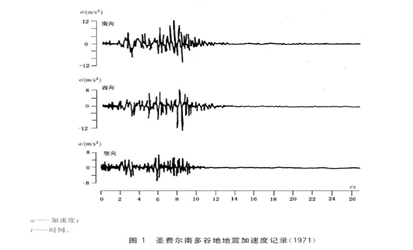
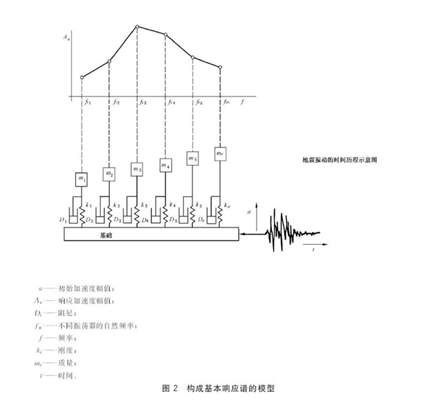
Figure 2 shows the model of the response spectrum. It records the response of the initial amplitude of the oscillator at a fixed characteristic frequency fti (i=1~n) and constant damping. When the characteristic frequency excitation is longer and stronger, the amplitude of the oscillator will be greater.
3.2) Basic response spectrum
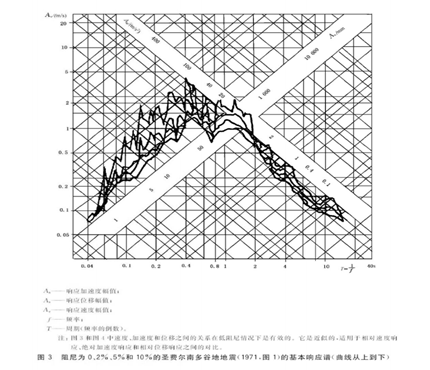
If the time history data of ground motion at and near a certain location during an earthquake is recorded, it is used to establish a response spectrum. Derive the basic response spectrum that reflects seismic excitation by controlling shape changes.
A large number of representative basic response spectra determined from different earthquakes can describe the expected seismic stress in a certain region or region.
3.3) Prescribed response spectrum
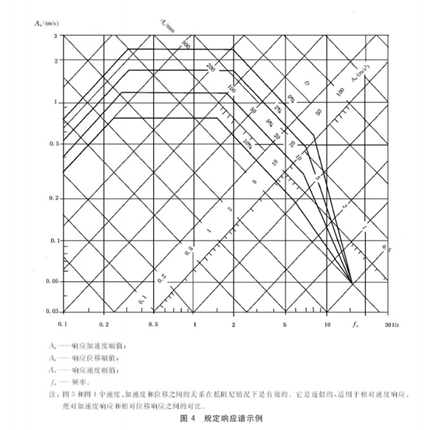
The envelope curve of the basic response spectrum is defined as the specified response spectrum, as it represents the specified vibration limit when an earthquake occurs at a given location or region. The different installation methods of products on a certain site may require different corrections to the response spectrum, depending on their supports (buildings, floors, casings, etc.). The spectrum (Figure 4) represents the relationship between frequency, amplitude (displacement, velocity, or acceleration), and damping in the experiment.
4. Seismic zoning map
Table 1 lists the distribution of different regions of seismic activity on the world map, as shown in Figure 5.

4.2.8 GB/T4797.8 Classification of Environmental Conditions Natural Environmental Conditions Fire Exposure
This section qualitatively and quantitatively describes the environmental conditions for the occurrence, development, and spread of fires within buildings, mainly related to the fixed use of electrical products.
This section mainly considers the conditions before and after flashover.
1. Overview
When a flammable substance receives sufficient energy in a space, a fire occurs, such as a burning cigarette or electrical short circuit igniting the material or the material itself generating this energy (self ignition). The determining factors of the combustion process are as follows (see Figure 1):
——Characteristics of energy sources;
——The type and geometric characteristics of the exposed material;
——Heat exposure time.
After ignition, a fire generates heat, some of which is used to maintain further combustion, and some is transmitted to other materials and products around it through radiation and convection. These materials and products may also burn when heated, leading to the spread of the fire (see Figure 2). Flammable materials inside buildings are usually ignited in a gaseous state.
Once a fire occurs in the space, the development and spread of the flame depend on (see Figure 1):
——The location, volume, and placement of fuel or combustibles, as well as the distribution, continuity, porosity, and combustion characteristics of combustion materials in space;
——Aerodynamic conditions within the space;
——The shape and size of the space;
——The thermodynamic properties in space.
If fire-fighting equipment is installed, the flame growth process will be affected by the design and working capacity of the fire-fighting equipment (such as the sprinkler system).
The development of fires typically involves complex interactions such as thermodynamics, aerodynamics, and chemical processes. Usually, radiation, convection, and flame spread are the main physical factors.
During the stage of flame growth, a layer of hot air flow will form at the top of the building. Under certain specific conditions, this layer of hot air flow may cause further development of the fire and cause most of the entire fire load to fall into the fire: flashover occurs.
Predicting flashover phenomena can refer to other standards. One of them defines flashover as the moment when a flame begins to occur in an open area within a building, and the temperature in the upper airflow is usually between 500 ℃ and 600 ℃; Another standard refers to the critical state, where the radiation generated on the ground level within a building or space is 20kW/m2. There are also other standards that are related to different physical conditions
Based on over a hundred experimental results and research on energy and mass balance, the following equation can be used to calculate the maximum heat release rate allowed to avoid flashover in a specified room or a space not exceeding a few cubic meters (non combustible walls and roofs) [see equation (1)]:
Hc, perm √=19300 (akAt A √ h) 1/2........... (1)
In the equation:
Hc, perm - maximum heat release rate, in watts (W);
Ak - Effective thermal conductivity coefficient of a room or spatial structure, in watts per square meter per Kelvin [W/(m2 * K)];
At - All internal surface areas of a room or space, including open areas, in square meters (m2);
A - The total area of the open area, in square meters (m2);
H - The height of the opening, in meters (m).
Flashover marks the transition from the stage of fire growth (before flashover) to the stage of full fire development (after flashover).
The fire before flashover has decisive significance for the operation and function of fire protection products. And these products play a crucial role in ensuring personnel escape and rescue. Detectors, alarms, related cables, warning lights, etc. should respond at this stage.
The fire after flashover is very important for the fire performance of the fire load structure. The fire spreads from one room to another through isolation or ventilation systems (as shown in Figure 1), from one floor to another, and from one building to another. A fire that is relatively small in terms of space is likely to damage structural units that are not properly protected during the pre flashover stage on a large scale. The entire fire process - before and after flashover - has an important relationship with firefighters. Finally, the understanding of post flashover fires is the primary condition for evaluating the safety of demolition teams, analyzing residual states, and the possibility of building repair or reuse after a fire.


2. Fire characteristics before flashover
The description of the basic characteristics of pre flashover fires is as follows:;
——The combustion characteristics of exposed materials and products interact with the following parameters:
The heat provided;
Exposure time;
The time when flames or smoldering occur;
The geometric shape of the location;
Thermodynamic data.
——Time variable:
Heat release rate (RHR);
Flame spread rate;
Gas temperature;
Smoke and its optical properties;
The composition of combustion products, especially corrosive and toxic gases.
The small-scale fire response tests mainly used for building materials and products are in the process of development, as shown in the relevant research of ISO TC 92:
The fire tests of building materials, components, and structures are all aimed at the characteristics of pre flashover fires. By setting different exposure levels, these tests can provide quantitative responses of materials and products under different fire situations.
The relevant standards for fire response testing are as follows:
——GB/T 14523 2007;
——ISO 5658.2:1996;
——ISO 56603:2003;
——ISO/TR 5924:1989;
——ISO 19702:2006.
The relevant standards for ignitability, heat release rate, and flame spread have been applied in practice. As a supplement to small-scale testing, ISO 9705:1993 is used for simple full-scale spatial corner testing of surface products. Smoke, especially the toxic combustion products, is of great significance for the study of small-scale experiments.
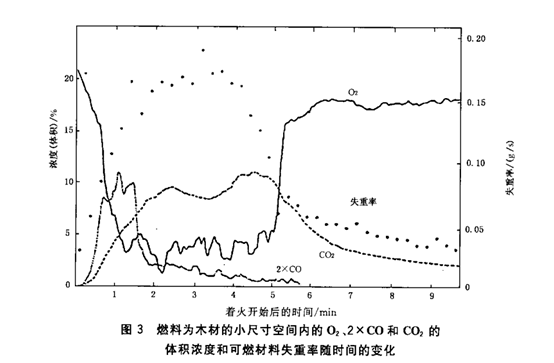
Figures 3 to 6 show the relationship between actual exposure levels and the basic characteristics of three different fires before flashover.
Figures 3 and 4 depict the situation of a fire in a well ventilated space. Figure 3 shows the variation of combustion rate over time, represented as the weight loss rate. For small-scale space fires fueled by wood, there are mainly oxygen, carbon monoxide, and carbon dioxide.
The concentrations of various gases during the combustion process are determined using the Raman spectrogram method, which can measure the concentrations of all gases in the ignition space at the same time.
Figure 4 shows the fire situation in a fully ventilated room, with walls made of combustible materials and ignited by a gas stove in the corner to simulate a burning waste paper basket. The main variables given are: heat release rate (RHR), temperature below the ceiling, heat flow rate on the floor, and smoke generated, in units of obscura (ambiguity) multiplied by cubic meters (1 obscura means that for every increase in light absorption of 1 db/m, the visible light distance is shortened by 10 meters). The flame undergoes a flashover phenomenon after 4.1 minutes, with a heat release rate of 1.25Mw. The gas temperature below the ceiling is exactly below 600 ℃, and the heat flux on the floor is 30kw/m2.
The examples in Figures 3 and 4 represent the ignition situation before flashover in a well ventilated space. However, situations are more common in non ventilated or enclosed spaces. A typical non ventilated fire is usually generated by the expansion of smoldering, which may also develop into flames and expand. Figures 5 and 6 show the ignition characteristics in a space without wind. Figure 5 applies to flames in spaces that are enclosed except for gaps between the ceiling and floor. Figure 5 shows the calculation time when critical events such as smoke generation and flashover occur in space. The definition of smoke generation is the time when the smoke layer lowers to a height of 1.5m above the floor. Assuming that the space safety assessment is unreasonable, firefighting can be dangerous and difficult. Figure 5 shows the calculation time for the specified sprinkler device and smoke and heat detector to start operating.
Considering the flashover time, Figure 5 also provides a comparison of the ignition situation in a non ventilated space and a space ventilated at the ceiling to release the heat and smoke generated during the ignition process. Figure 5 shows that the non ventilated conditions shorten the time of flashover, and the time of flashover occurrence decreases with the decrease of flame development doubling time.
In order to supplement the characteristics of the non ventilated flame shown in Figure 5, Figure 6 shows the variation of carbon monoxide concentration over time during smoldering under non ventilated conditions: the variation of CO concentration over time due to chair smoldering in a room with a floor area of s at a height of 2.4m, taken from the middle height of the room. The flame is caused by a chair at a certain height from the floor, and varies depending on the floor area. These data are extrapolated based on experiments and theoretical models, and are related to the assumed sensors placed at the midpoint of the room height. The figure shows and marks the time t0 (representing the time when the layer interface decreases to this point) and time t * (the time when the critical dose is exceeded) on the curve.
The fire situation before flashover can be considered based on the probability of the following items:
——The presence of ignition sources;
——The existence of the product;
——Product ignition characteristics;
——Environmental factors;
——Human existence;
——The presence and operation of alarm and fire extinguishing devices;
——The possibility of escape.
Especially important is that because these products have a high heat content (upholstered furniture, plastic bulky furniture, mattresses) or a large surface area (wall and ceiling decoration, large curtains, etc.), they can themselves turn a portion of a fire in the room into a flashover.
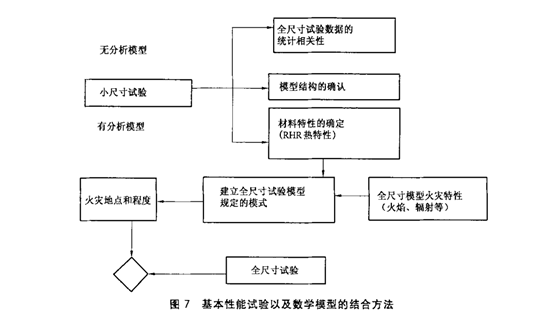
From a practical and long-term perspective, the evaluation of small-scale fire response test results for predicting fire hazards should be based on basic performance tests and mathematical modeling methods. Figure 7 provides an outline of a method for evaluating the contribution of experimental materials to fire safety.
If there is no small-scale mathematical model available, the test results should be directly related to the statistics of full-scale test data. If there is an effective mathematical model for small-scale experiments, the important material properties that control the development of space flames can be quantified, and this value can be used as input data for the mathematical model of fire before flashover in the full-scale model. By using this mathematical model, which has been supported and validated through full-scale experiments, it is possible to predict the changes in the degree of ignition and location of the space under different environmental conditions at any time. Relevant safety measures can be sought from evaluation methods currently used by other departments for the efficiency, sensitivity to disturbances, and reliability of complex systems.
